selection of figures for Chris ( more available)
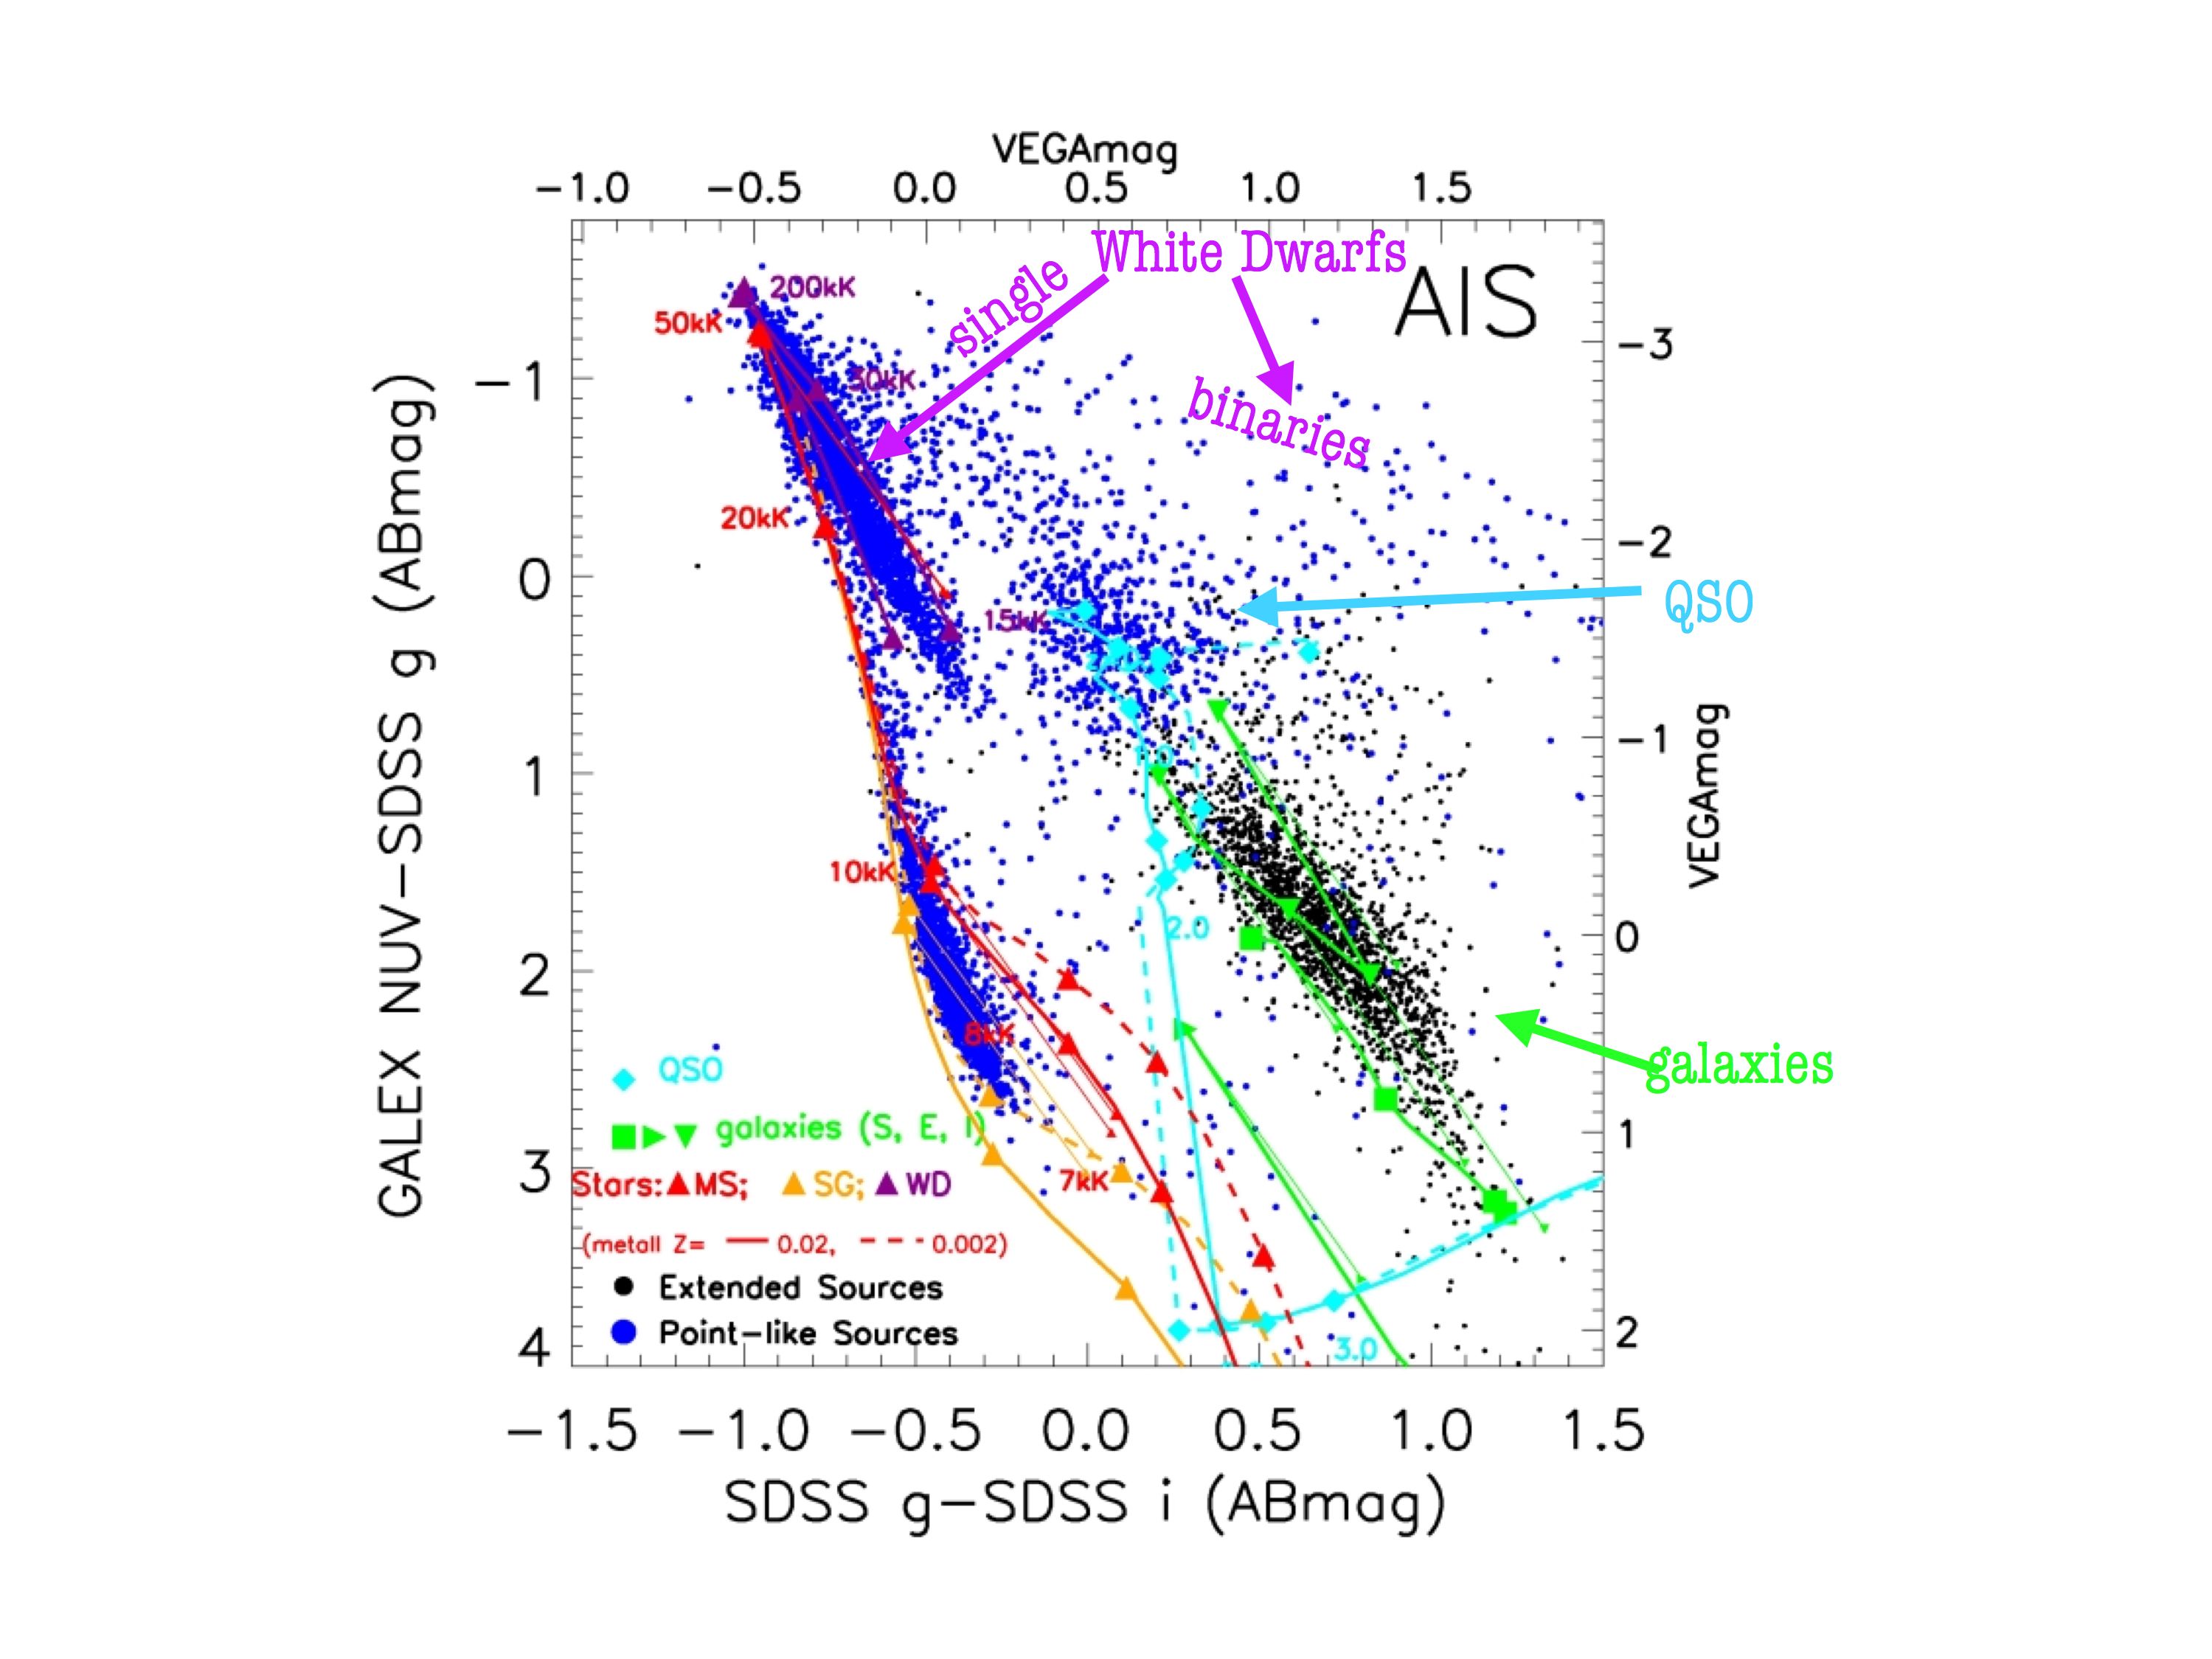
Caption: UV sources from Bianchi's (2008) matched GALEX-GR3-AIS / SDSS-DR6 sample: blue dots are point-like sources,
black dots are extended sources (mostly galaxies). Model colors for stars with log g=3 (yellow), 5 (red),
7 and 9 (purple) are shown for different T$_{eff}$. Most point-like hot sources are bracketed by the
log g=7 and log g=9 stellar sequences, and they are WD or sub-dwarfs. Note the QSOs color locus for z=0.-1.6
(and a cluster of QSO points) well separated from stars and galaxies. Another very interesting feature is
an arc-like distribution of point-like sources (blue dots),
which are mostly stellar binaries containing a hot WD and a cooler star.
Thin-line arrows show extinction effects for E(B-V)=0.5.
Left: tracks of binary stars (various combinations)in pink and purple. Middle and right: Large dots (pink, yellow, etc) are the known CVs included in the galex/sdss overlap
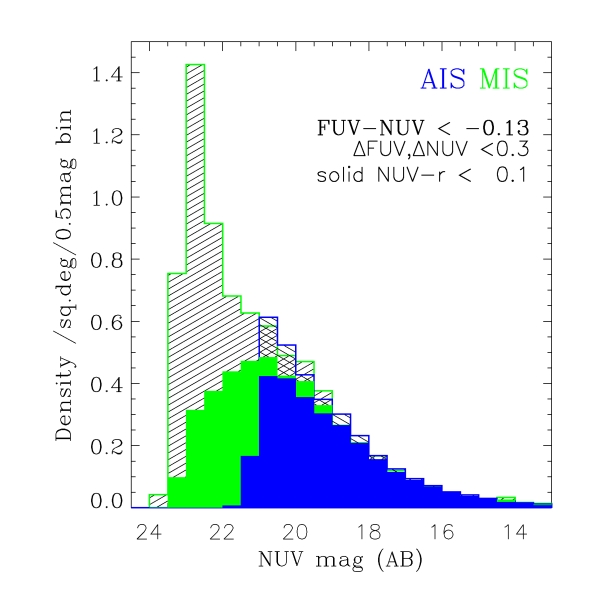
Density of WD candidates (AIS and MIS) hotter than 20,000K as a function
of magnitude (all latitudes).
Solid color histograms are the ``single WD''
candidates, dashed histograms include also sources with WD-like UV color and redder optical
colors: these are candidate binaries including a WD and a cooler star, but also contain a high
number of extragalactic objects (FUV_bright QSOs) at the fainter magnitudes.
The AIS sample has larger sky coverage, thus better statistics. It
agrees with the MIS counts until it becomes incomplete, and drops at $\sim$21~mag.
The ``single-WD'' sample (solid colors) has a purity of over 95\%, while the increase of the dashed
histograms at faint magnitudes is due to contamination by extragalactic objects (see e.g. Bianchi et al.2007)
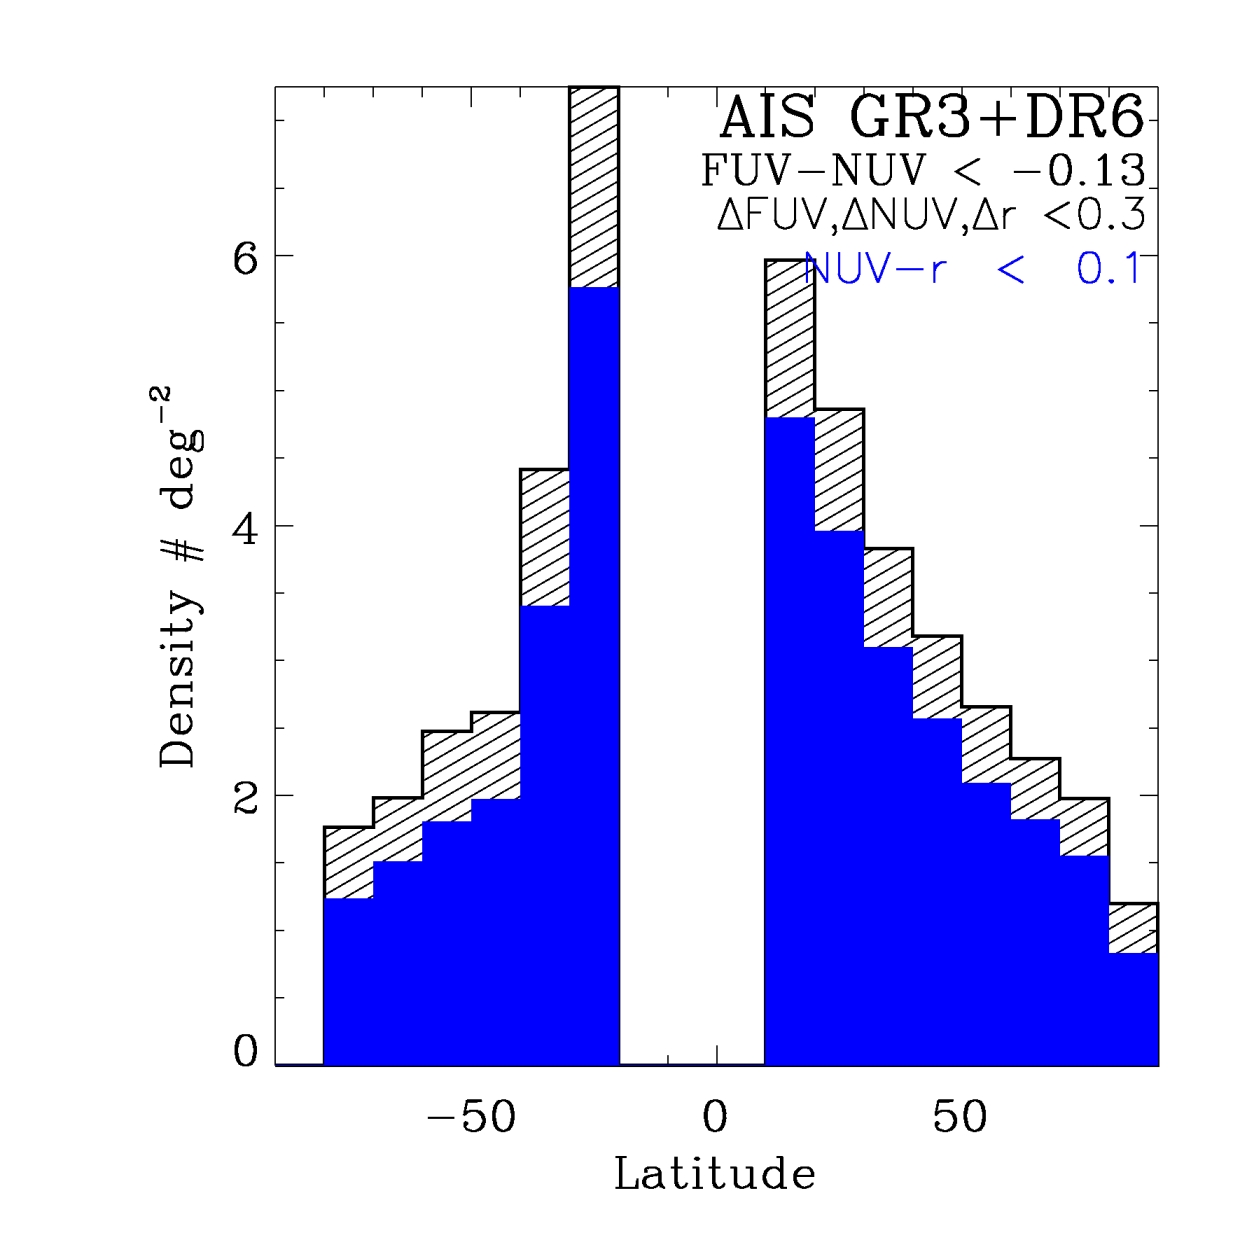
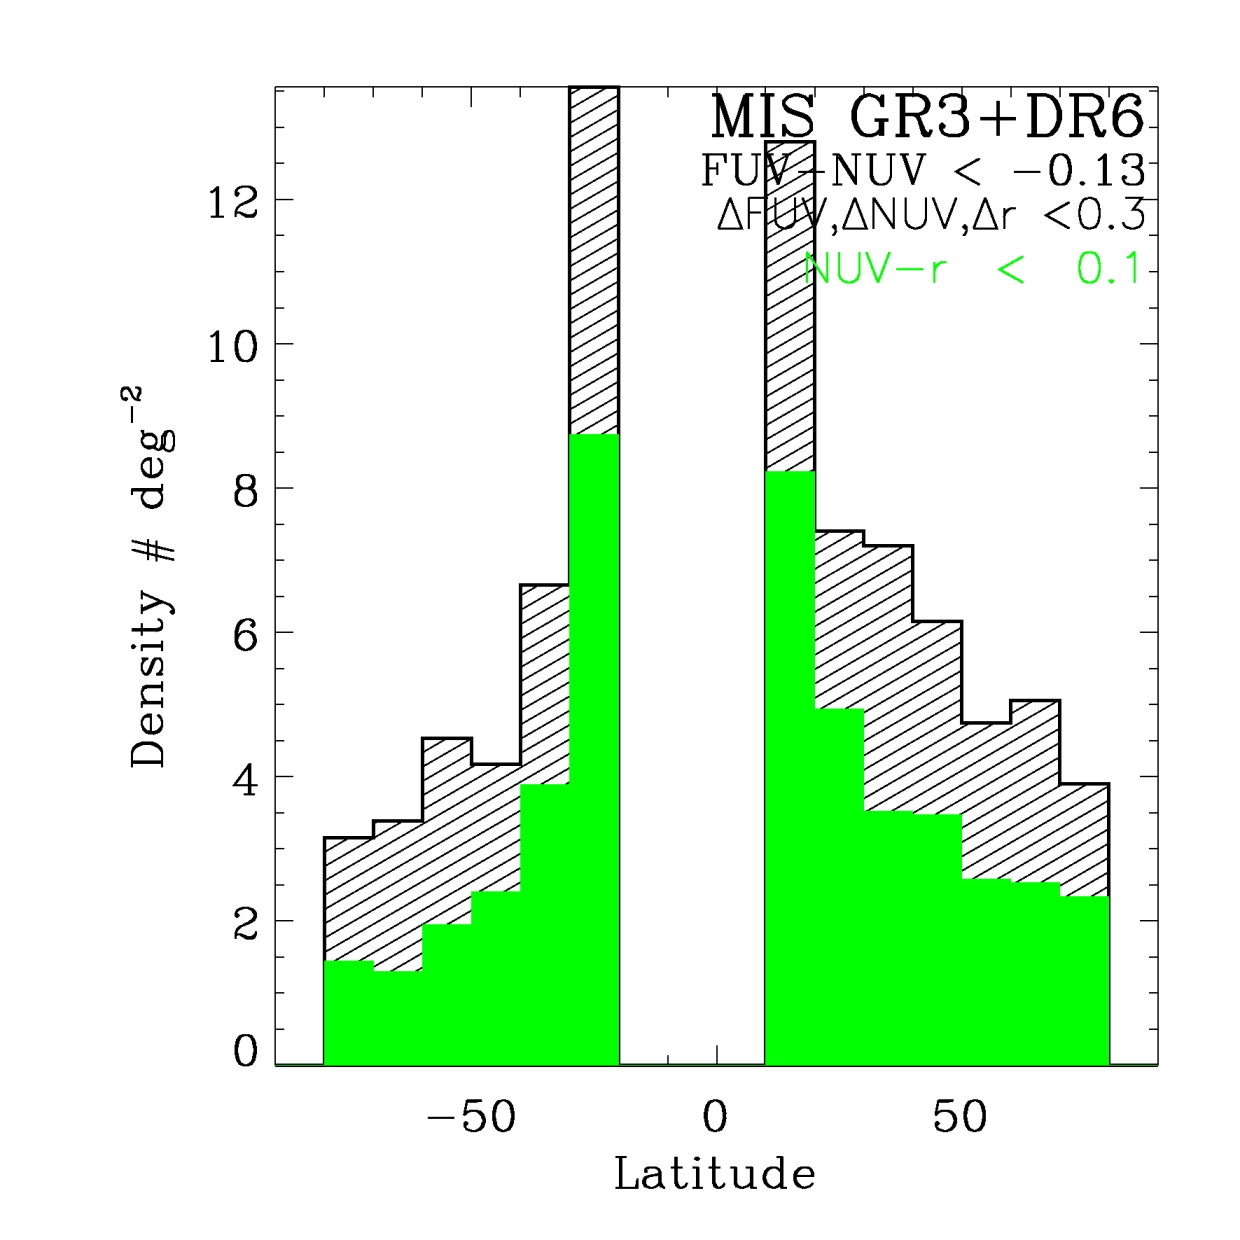
Caption: Density of WD candidates from AIS (blue) and MIS (green) as a function
of Galactic latitude (all magnitudes), from GALEX samples covering 3400(AIS)/570(MIS) sq.degrees. Solid color histograms are the ``single WD''
candidates, dashed histograms include single and candidate binaries (WD and a cooler star), but the latter contain also a high
number of extragalactic objects at the fainter magnitudes. Note the different scale used, because MIS
reaches fainter magnitudes therefore the counts are higher. The bins have varying statistical significance according
to the available coverage in different latitude slices. Extinction
effects have not been taken into account in these plots, yet the MW structure is emerging with
variations by over a factor of five.
 click for ps figure
The surface density of low-redshift QSO candidates from GALEX GR1 (Bianchi et al. 2007)
MIS (green) and AIS (blue). Histograms only outlined
include both point-like and extended sources in the color locus of
the QSOs. Shadow-filled histograms
include only point-like sources with the same color selection.
The solid orange histogram shows the SDSS QSO catalog.
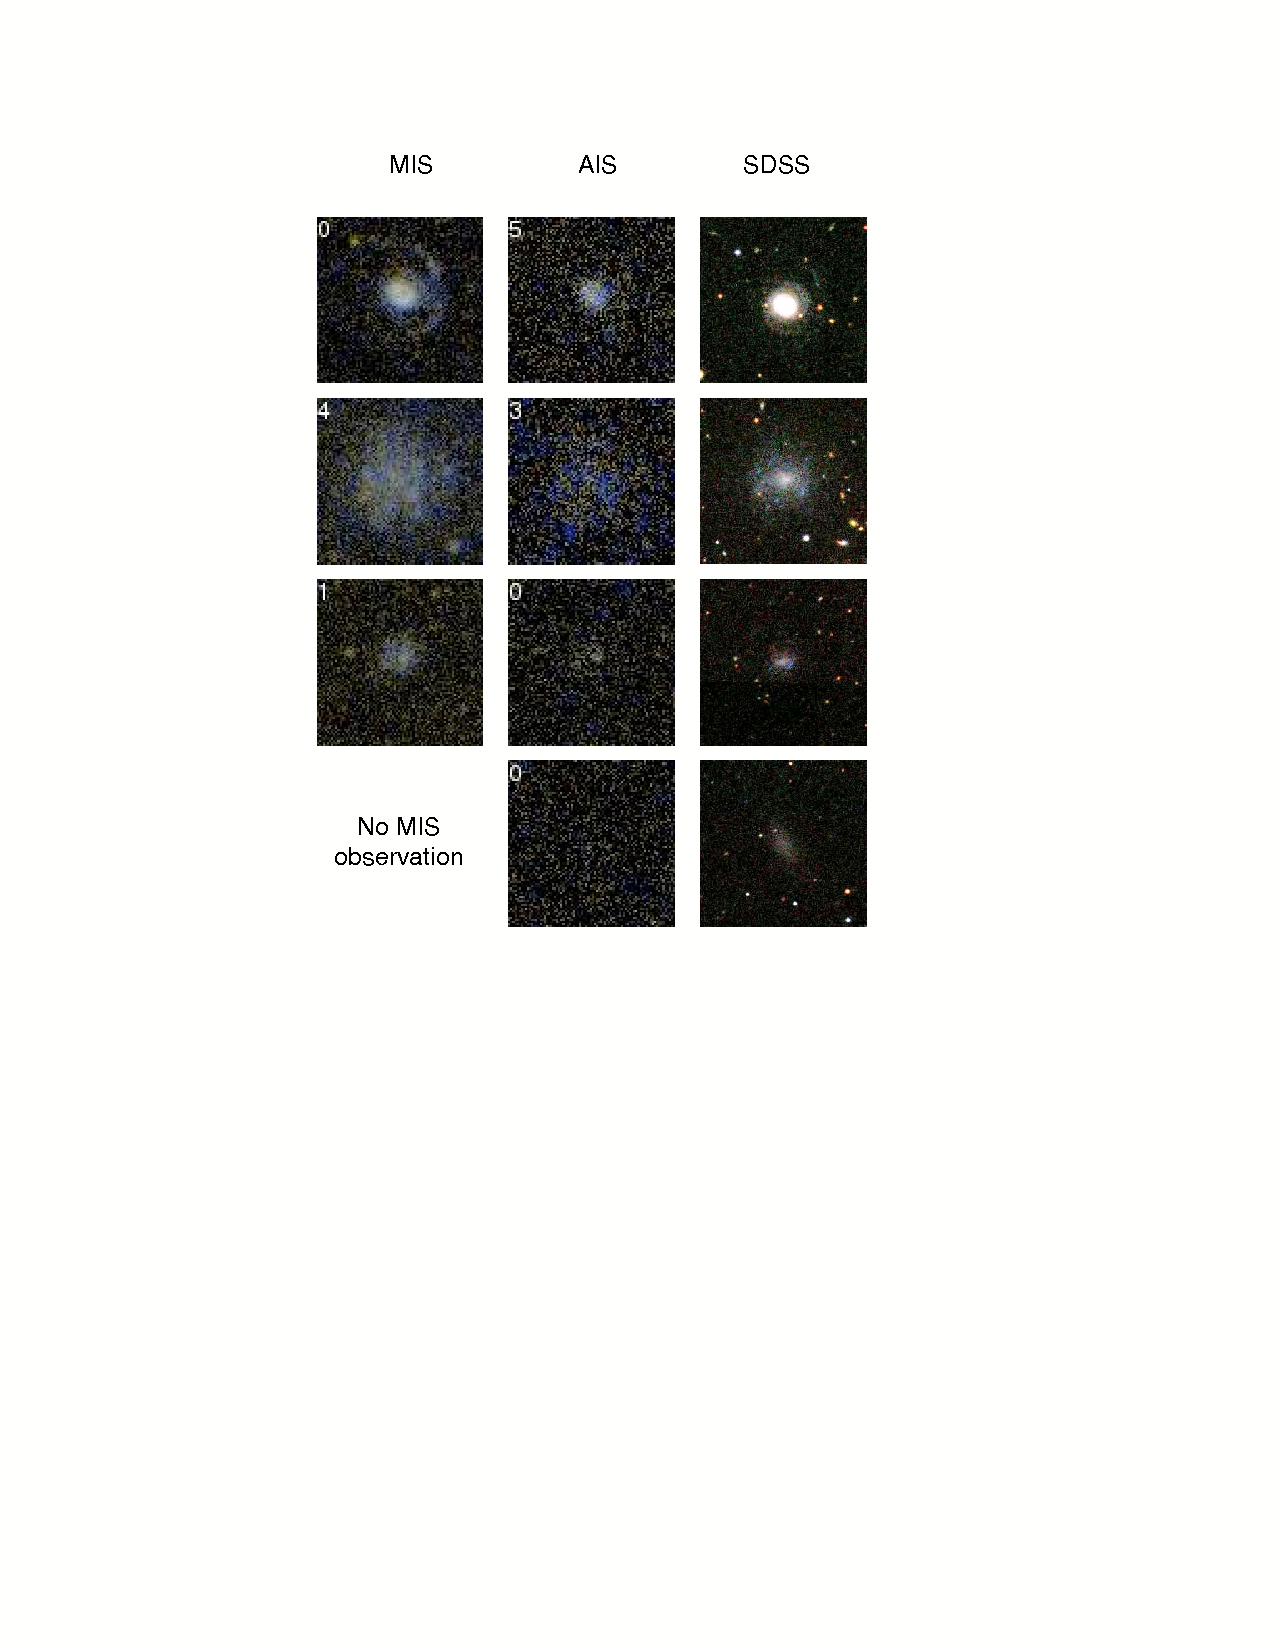 LSB figure
Figure showing sample LSB and the need for MIS data
LSB figure
Figure showing sample LSB and the need for MIS data